
A New Measurement Method of the Dynamic Contact Resistance of HV Circuit Breakers
M. Landry*, A. Mercier, G. Ouellet, C. Rajotte, J. Caron, M. Roy Hydro-Québec
Fouad Brikci Zensol Automation Inc.
(CANADA)
Introduction
The design of modern high-voltage puffer-type SF6 gas circuit breakers is based on the switching of two parallel contact sets. First, the low-resistance silver-plated contacts or the main contacts are specifically designed to carry the load current without any excessive temperature rise. Second, following the main contact part, the tungsten-copper arcing contacts are finally opened, thus initiating arc quenching and current interruption.
To assess the condition of the breaker contacts, the main contact resistance measurement is usually performed. However, the static resistance measured when the breaker remains in a closed position does not give any indication of the condition of the arcing contacts. To evaluate the latter’s condition, an internal inspection can be done, but time-consuming and costly maintenance procedures must be followed in order to securely handle the SF6 gas and arc by-products. It should be remembered that excessive arcing-contact wear and/or misalignment may result in a decrease of the circuit breaker’s breaking capacity.
The dynamic contact resistance measurement (DRM) was developed over 10 years ago to assess the condition of the arcing contacts without dismantling the breaker. This method is no longer widely used since the interpretation of the resistance curve remains ambiguous. Previously published test results usually depicted several spikes [1-3] in the resistance curve which could be the result of a partial contact part during the contact movement.
The following paper presents a new dynamic-contact-resistance measurement method that has been validated by field tests which were performed on air-blast and SF6 gas circuit breakers. The new method is based on the breaker contact resistance measurement during an opening operation at low speed. After reviewing the characteristics of the dynamic resistance curve and the measuring system and parameters, the paper deals with relevant values that can be extracted from the resistance curve for detecting contact anomalies wear and/or misalignment. Finally, case studies are presented and test results are discussed.
1. Measuring system and sensors
For dynamic contact resistance measurements (DRMs), three signals must be recorded:
- the injected current (IDC) of at least 100 A in order to minimize relative noise level;
- the voltage drop (VD) across the breaker contacts;
- the breaker contact travel
Since the new DRM method presented in this paper will be performed during an opening operation at low contact speed when the breaker is off-line, some commercial acquisition units with the following features may be used:
- 3 analog inputs with at least 12-bit resolution and appropriate range of voltage inputs;
- a sampling frequency of £ 10 kHz;
- a total acquisition time of 30-100 s;
- connection to a portable computer for calculation of the instantaneous contact resistance (VD/IDC), data analysis and interpretation using dedicated
Finally, the following sensors are required:
- Hall-effect current sensor allowing accurate measurement of both the current amplitude and the abrupt current variation at the arcing contact part that corresponds to the complete breaker contact opening;
- linear or rotary contact travel sensor depending upon the breaker
2. Measuring parameters
- Closing operations
DRMs during closing operations are not generally useful since the measurement must be performed during a transient state, i.e. from open to closed contacts. There are two main reasons why the measurement in this condition is impractical:
- the abrupt resistance variation from infinity (open contacts) to the arcing contact resistance is difficult to measure, making the resistance level of the arcing contact difficult to detect;
- the transient DC current at the moment of arcing contact touch generates undesired noise level and therefore jeopardizes the
2.2 Opening operations at low contact speed
DRM should be rather performed during opening operations at low contact speed (» 0.002-m/s). Figure 1a shows superimposed typical resistance curves of two consecutive measurements at rated speed on break A (Table 1). The two traces have been synchronized by superimposing instants of the main contact part which is identified as tm in the Figure 1a graph. Note that no filtering has been
At the rated speed, it can be observed that the resistance curves are not reproducible from one test to another. Moreover, this phenomenon is more marked in the vicinity of the arcing contact part. During the validation test program, it was observed that this behaviour is completely random. On the contrary, for the same breaker A, Figure 1b shows two dynamic contact resistance curves obtained at low contact speeds of 0.2 and 0.15 m/s. The two traces have also been synchronized by superimposing instants of the main contact part. Except for the fact that the curves exhibit different instants of the arcing contact part which are due to measurements at different contact speeds, the two resistance curves appear to be almost identical. To eliminate these time deviations resulting from the contact speed, the dynamic contact resistance may be plotted as a function of the contact travel (section 3.3).
For break B (Table I), Figure 1c depicts another DRM curve that was recorded at the rated contact speed. Several spikes can be observed. Moreover, it is absolutely impossible to identify the main contact part. The presumed main contact part is indicated based on other measurements at low contact speed. As for break A, it is anticipated that this phenomenon is caused by partial contact part due to high contact speed and acceleration. At low contact speed, the DRM curve is far smoother and the main contact part can be easily identified (Fig. 1d).
It must be pointed out that partial contact part does not occur when a high current is interrupted since electromagnetic forces are exerted on the contacts, maintaining them together until final contact separation. Therefore, it is assumed that the low-speed DRM more adequately simulates the actual operating conditions of an in-service HV circuit breaker.
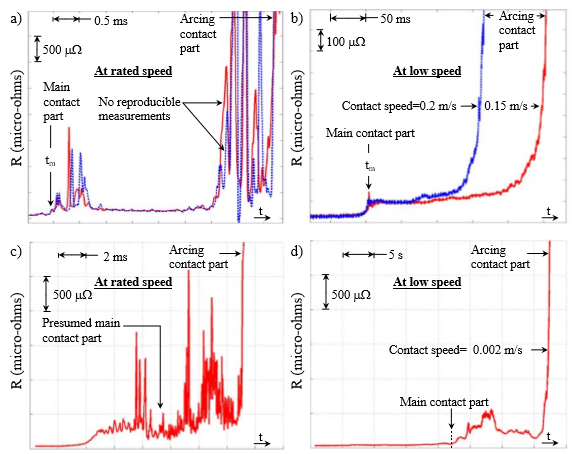
Figure 1- Comparison of the dynamic contact resistance curves according to the conventional (at rated speed) and the new (at low speed) methods
- At rated speed on break A b) At low speed on break A
- c) At rated speed on break B d) At low speed on break B
3. Parameters to be extracted from the dynamic resistance curve
- Contact wear algorithm
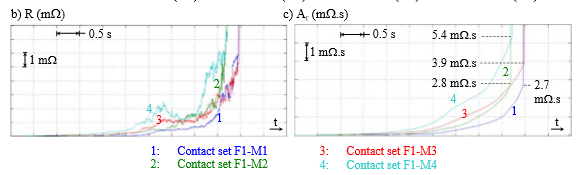
A contact wear algorithm was developed for the new DRM method. Figure 2b depicts the contact resistance curve for different contact sets of an HV air-blast circuit breaker: one relatively new fixed contact (F1) and four moving contacts in different stages of wear (Fig. 2a): a new contact (M1), a slightly worn contact (M2), a worn contact (M3) and a seriously damaged contact (M4), thus forming 4 complete contact sets (F1-M1, F1-M2, F1- M3 and F1-M4). These contact sets were mounted in a laboratory test set-up comprising a vertical computer-numerical-control milling machine, thus allowing the contacts to be closed and opened at a relatively constant and low contact speed. For each contact set, Figure 2c shows the curves of the cumulative area beneath the dynamic contact resistance curves of Figure 2b. The area value (Ar) just before the beginning of the vertical slope corresponds to the maximum value reached just before the arcing contact part. For the different contact sets, the Ar value is:
- 7 mW.s for the new contact set F1-M1;
- 8 mW.s for the slightly worn contact set F1-M2;
- 9 mW.s for the worn contact set F1-M3;
- 4 mW.s for the seriously damaged contact set F1-M4.
These Ar values provide an excellent assessment of the actual condition of the contact sets. In
a)
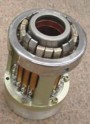
Relatively new fixed contact (F1)
New moving contact (M1)
Slightly worn moving contact (M2)
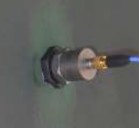
Worn moving contact (M3)
Seriously damaged moving contact (M4)
- R (mW) c) Ar (mW.s)
1: Contact set F1-M1 2: Contact set F1-M2
3: Contact set F1-M3 4: Contact set F1-M4
Figure 2- Wear contact analysis by evaluating the area beneath the dynamic contact resistance curve for different contact sets
- View of the fixed and moving contacts
- Graph of the dynamic contact resistance curves
- Graph of the cumulative area beneath the dynamic contact resistance curves
fact, the Ar value increases based on contact wear. The seriously damaged contact is clearly identified since the Ar value (i.e. 5.4 mW.s) is twice that for the new contact set (2.7 mW.s).
3.2 Graph of the contact travel curve and resistance curve
Figure 3a depicts a typical dynamic resistance curve during an opening operation at low speed where t0 corresponds to the beginning of the breaker contact motion. In most breaker operating manuals, the procedure for performing such a low speed opening is given. It is always relevant to superimpose the travel curve of the breaker contact in order to extract diagnostic parameters related to the position of both the main contacts and the arcing contacts.
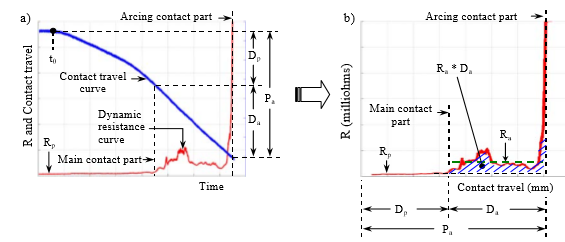
Figure 3- Parameters to be extracted from the dynamic contact resistance curve
- Contact resistance and contact motion as a function of time
- Contact resistance as a function of contact travel
These parameters are:
- Rp (mW): Average main contact resistance
- Dp (mm): Main contact wipe
- Da (mm): Arcing contact wipe
- Pa (mm): Position of the breaker contacts at the arcing contact part
3.3 Graph of the resistance curve as a function of the contact travel
To compensate for the fact that the dynamic resistance curve is measured at a low contact speed that is not necessarily constant for the two test series (Fig. 1a), the contact resistance graph must be plotted as a function of the contact travel (Fig. 3b) in order to evaluate two additional parameters for diagnosing the arcing contact conditions:
- Ra (mW): Average arcing contact resistance = (S Ri=1,N) / N (Fig. 3b), N= Number of samples in the interval Da
- Ra*Da (mW.mm): Area beneath the resistance curve as a function of the contact travel (Fig. 3b)
The latter parameter provides a criterion for evaluating the global breaker contact wear and/or contact alignment status. Once the graph is plotted, all diagnostic parameters can be deduced, including those in section 3.2. Since this graph can be considered as complete for diagnosing the breaker contact condition, it will be given for each case study presented in the following section.
4. Case studies
The new DRM method was validated in the field on SF6 gas circuit breakers. Three case studies are presented in the following section. Table I summarizes the measurement results for which abnormal values are highlighted.
4.1 Case study No. 1: One break of a 315-kV capacitor-bank SF6 gas circuit breaker
Figure 4 presents the DRM results on a break (Break A, Table I) of a 315-kV capacitor-bank SF6 gas circuit breaker which has performed 2492 operations. Based on this graph and the results listed in Table I, it can be deduced that the arcing contacts are in excellent condition. In fact, the Ra value of 185 mW is almost constant throughout the contact motion. The global criteria Ra*Da is also relatively low, i.e. 3.6 mW.mm. In addition, the main contact part can be easily detected.
Table I – Summary of DRM results
| Case study No. | Break description | Operation counter reading | Rp (mW) | Ra (mW) | Dp (mm) | Da (mm) | Pa (mm) | Ra*Da (mW.mm) |
| 1
(Fig. 4) |
A | 2492 | 29 | 185 | 15.1 | 19.5 | 34.6 | 3.6 |
| 2
(Fig. 5) |
B | 687 | 37 | 420 | 21.3 | 24.6 | 45.9 | 10.3 |
| C (Contact overhaul) | < 20 | 33 | 173 | 30.8 | 19.7 | 50.5 | 3.4 | |
| 3
(Fig. 6) |
D
(Internal restrike) |
204 | 74 | 1763 | 31.4 | 34.2 | 65.7 | 60.3 |
| E
(Normal break) |
201 | 34 | 93 | 33.8 | 33.5 | 67.2 | 3.1 |
Break A: Break of a 315-kV capacitor-bank SF6 gas circuit-breaker Break B: Break of a 120-kV capacitor-bank SF6 gas circuit-breaker Break C: Same as break B, except that arcing contacts were overhauled
Break D: Break (with internal restrike) of a 230-kV SF6 gas reactor circuit-breaker Break E: Same as break D, but without internal restrike
4.2 Case study No. 2: One break of a 120-kV capacitor-bank SF6 gas circuit breaker
Case study No. 2 (Fig. 5) presents the DRM results on a break (Break B, Table 1) of a 120-kV capacitor-bank SF6 gas circuit breaker which has performed 687 operations.
In February 2000, a major failure occurred on this circuit breaker which caused important damage to the surrounding equipment. An investigation of the breaker failure revealed that an arcing contact tip appeared to have broken off during an opening operation and thus impaired the subsequent closing operation.
In the fall of 2002, the DRM was
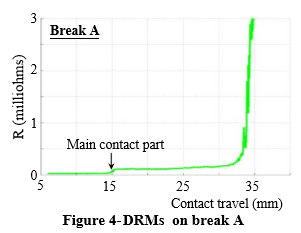
Figure 4- DRMs on break A
performed. Based on the Figure 5a graph, the parameters defined in section 3 were extracted
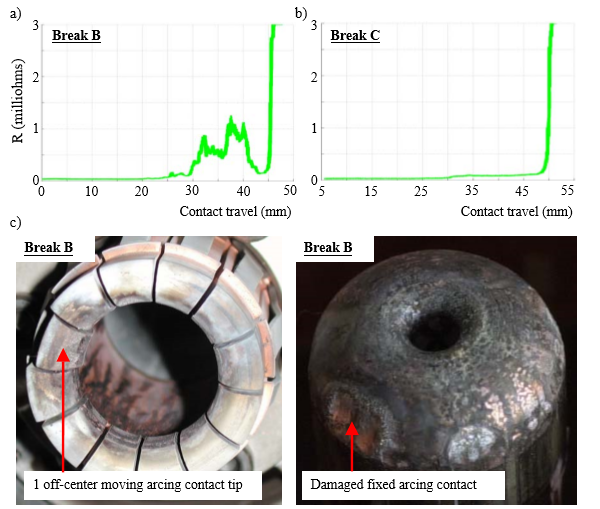
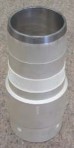
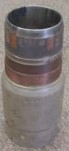
Figure 5- Dynamic contact resistance measurements on one break of a 120-kV capacitor- bank SF6 gas circuit-breaker
- Dynamic resistance curve before contact dismantling
- Dynamic resistance curve after contact overhaul
- View of the damaged moving and fixed arcing contacts
and listed in the case study No. 2 row in Table I. The instantaneous arcing contact resistance reaches an abnormal peak of 1 mW while the average value (Ra) of 420 mW could be interpreted as normal. The most relevant factor is the product Ra*Da that reaches 10.3 mW.mm, thus suggesting a contact anomaly. As mentioned in section 3, this factor represents the cumulative area beneath the resistance curve, thus summing the resistance variations or the contact wear during arcing contact opening.
Photos of the moving and fixed arcing contacts of the tested break are shown in Figure 5c. On the moving arcing contact, it can be observed that one arcing contact tip is off center. This abnormality caused damage to the fixed arcing contact (see right-hand side photo). It is believed that this condition occurred due to a misalignment of the arcing contacts at the break assembly. After an arcing contact overhaul and careful contact alignment, the DRM was performed one more time. Figure 5b presents the measurement results that showed that the arcing contact condition was definitely restored. In fact, the Ra value of 173 mW is low. Furthermore, the low Ra*Da value of 3.4 mW.mm indicates that the arcing contact is in excellent condition.
- Case study No. 3: One break of a 230-kV reactor SF6 gas circuit breaker Figure 6a presents the DRM results for break D (Table I) for which an internal breakdown occurred without a major failure. In this case, the Ra value is about 2 mW, which indicates very severe damage to the arcing contacts. The global value Ra*Da of 60 mW.mm is the
highest value that was ever obtained during the validation test program. The break was
dismantled and arcing traces on both the moving and fixed arcing contacts as well as on the supporting tube of the main contacts were observed.
For comparison purposes, Figure 6b gives the DRM results for a normal break (Break E, Table I) of the same circuit breaker. Based on the curves and the extracted value in Table I, the arcing contacts of this break are clearly in excellent condition. In fact, the Ra value of around 100 mW is almost constant from the main contact part up to the arcing contact part.
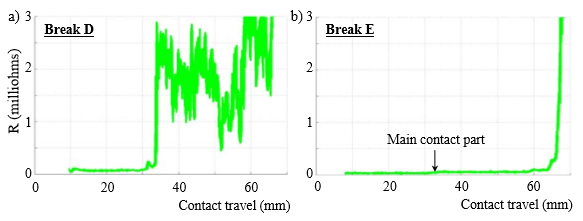
Figure 6- DRM results on breaks of a 230-kV reactor SF6 gas circuit-breaker
- Resistance curve following an internal restrike of the break D
- Normal break E
Conclusion
This paper presents a new dynamic contact resistance measurement method performed during opening operations at low contact speed aimed at evaluating the breaker condition without dismantling it. Compared to the DRM curves at the rated contact speed, the new method allows reproducible curves to be obtained which are easy to analyze and interpret.
Three signals must be measured: the injected DC current that must be produced by a stable source, the voltage drop across the breaker contacts and the contact travel.
To extract the diagnostic parameters, a dedicated software program was developed in order to plot the dynamic resistance curve as a function of the contact travel, i.e. mW versus mm. Six vital diagnostic parameters values are therefore determined:
- average main contact resistance;
- average arcing contact resistance;
- main contact wipe;
- arcing contact wipe;
- position of the breaker contact at the arcing contact part;
- and the cumulative area beneath the resistance
The last parameter is the most relevant one since it allows the overall contact wear and/or contact alignment status to be assessed. Moreover, values obtained from different breaker technologies can be compared. For example, values of about 3 mW.mm indicate healthy breaker contacts while values of about 10 mW.mm indicate faulty contacts.
The three case studies presented in this paper prove that the new DRM method provides vital information about the breaker contact condition. Without dismantling the breaker, the maintenance crew can thus plan maintenance work for specific breakers for which the DRMs reveal contact anomalies.
References
- Salamanca F., Borras F., Eggert H., Steingräber W., Preventive Diagnosis on High- Voltage Circuit Breakers, Paper 120-02, CIGRE Symposium, Berlin, 1993.
- Kumar Tyagi R., Singh Sodha N., Condition-Based Maintenance Techniques for EHV- Class Circuit Breakers, 2001 Doble Client
- Ohlen , Dueck B, Wernli H., Dynamic Resistance Measurements – A Tool for Circuit Breaker Diagnostics, Stockholm Power Tech International Symposium on Electric Power